
One of our teams has been periodically running an aggregate query against a half dozen tables, of varying sizes, across four databases. One of the tables will not stay permanently; it is a small heap (300K rows, 10MB) with a LOB column (nvarchar(max)) being used temporarily to filter SKUs.
Every once in a while, the query causes this obnoxious stack dump:
Location: lobss.cpp:725
Expression: 0
SPID: 420
Process ID: 22984
Description: Should never happen
Msg 3624, Level 20, State 1, Line 5
A system assertion check has failed. Check the SQL Server error log for details. Typically, an assertion failure is caused by a software bug or data corruption. To check for database corruption, consider running DBCC CHECKDB. If you agreed to send dumps to Microsoft during setup, a mini dump will be sent to Microsoft. An update might be available from Microsoft in the latest Service Pack or in a Hotfix from Technical Support.
Msg 596, Level 21, State 1, Line 0
Cannot continue the execution because the session is in the kill state.
Msg 0, Level 20, State 0, Line 0
A severe error occurred on the current command. The results, if any, should be discarded.
This is not good.
I read a software bug or data corruption and, after CHECKDB shrugged at all relevant databases, I ruled out corruption. Plus, the issue is intermittent; if there were exception-causing corruption on a page that gets read by a query, the exception should happen every time the query runs (and should get noticed by logical checks).
So, let's roll up our sleeves.
While the errorlog has some info about the dump, and the .mdmp file has all of the details, all you really need is SQLDump0nnn.txt. For deep analysis, you will probably really want to load the .mdmp file into WinDbg. But WinDbg is tedious. Microsoft's Arvind Shyamsundar has been tirelessly maintaining SQLCallStackResolver, as well as PowerShell scripts to download the right symbol files (the most frustrating part of using WinDbg IMHO).
The .mdmp and companion files are found in SQL Server's errorlog directory, which you can parse out of:
SELECT SERVERPROPERTY(N'ErrorLogFileName');
Boring, Aaron. To the dump, already!
I could have just forwarded everything to Microsoft support, and I still plan to do that properly this week, since it does need to be investigated by them to get an actual fix into the product. But it's definitely fun to spelunk on your own in the meantime. I downloaded the symbols for the relevant build of SQL Server 2017, and pasted the call stack from the text file into the application.
On the left is part of the raw dump, and on the right (well, unless your screen is small) is the symbolized call stack, matched line-for-line, with relevant highlighting courtesy me:
00007FFB6C43125E Module(sqllang+0000000000FB125E)
00007FFB6C43516D Module(sqllang+0000000000FB516D)
00007FFB6C479EAF Module(sqllang+0000000000FF9EAF)
00007FFB83D03694 Module(sqldk+0000000000113694)
00007FFB806DE1CF Module(sqlmin+000000000187E1CF)
00007FFB806DE0C1 Module(sqlmin+000000000187E0C1)
00007FFB7F7B54F5 Module(sqlmin+00000000009554F5)
00007FFB7F7B2684 Module(sqlmin+0000000000952684)
00007FFB7F7B1D6B Module(sqlmin+0000000000951D6B)
00007FFB7F743042 Module(sqlmin+00000000008E3042)
00007FFB848227C7 Module(sqlTsEs+00000000000027C7)
00007FFB7F7947D6 Module(sqlmin+00000000009347D6)
00007FFB7F794718 Module(sqlmin+0000000000934718)
sqllang!CStackDump::GetContextAndDump
sqllang!stackTrace
sqllang!utassert_fail_imp
sqldk!utassert_fail
sqlmin!LobStorageProvider::RaiseInternalError
sqlmin!LobStorageProvider::GetLobValueForRead
sqlmin!CBlobHandleFactoryMain::PilbGetILockBytesInternal
sqlmin!CBlobHandleHelper::CopyBlobHandleIntoTempOrInlined
sqlmin!CBlobHandleManagerCommon::PxvarPreprocessInternal
sqlmin!CValRow::SetDataX
sqlTsEs!CEsExec::GeneralEval
sqlmin!CQScanSpoolNew::PushRow
sqlmin!CQScanSpoolNew::LoadSpool
(And remember, the call stack is upside down, meaning newest event listed first.)
This tells me it has something to do with a spool and copying a LOB value into temporary workspace. I looked into three similar issues (including this example; they are either not solved, solved in a build we already have, or seem unrelated.
It's intermittent, so running the query again a minute later might work, or it might not. But telling the team to just twiddle their thumbs and try again later is not a solution.
I ran the query and, sure enough, when it doesn't produce a stack dump, it has these spools:
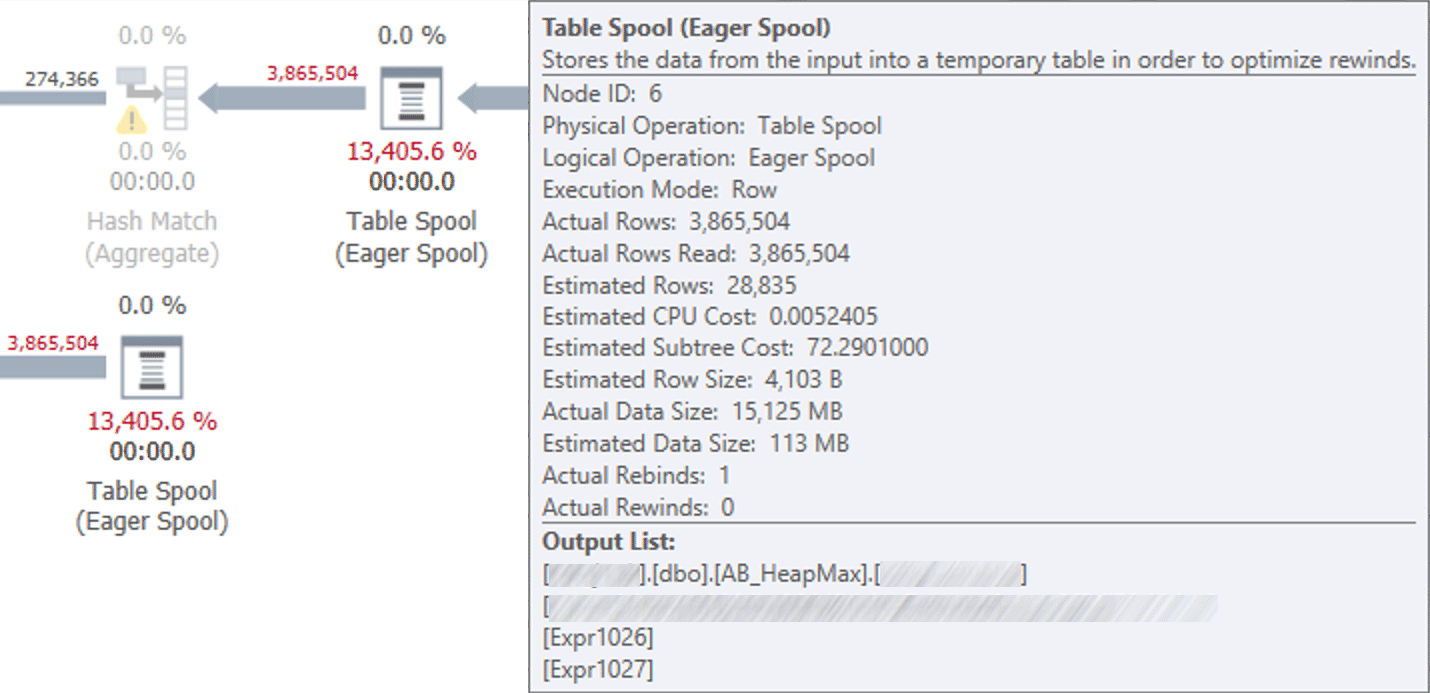 Plan showing two spools against the heap.
One important thing to note is that the nvarchar(max) column didn't need to be defined that way, since the longest string there is 8 characters (and it joins to an existing nvarchar(8) column).
Can we reproduce on a different table?
Unsure if the problem was the heap, the LOB column, or the combination, and still confident this wasn't corruption, I created copies of the table, populated with the same data, to try to isolate the issue:
- AB_HeapMax – a heap matching the original table structure.
- AB_CIXMax – a clustered index (but problematic column still
nvarchar(max)). - AB_HeapN8 – a heap, but the problematic column is now
nvarchar(8)(matching the join column). - AB_CIXN8 – a clustered index (problematic column is now
nvarchar(8)).
Then I ran the same query dozens of times, and for each set substituting these four table names in for the original heap. Immediate observations:
- AB_HeapMax still generated the stack dump (intermittently), about 20% of the time, further suggesting corruption isn't the issue. Interestingly, when my copy of the table caused the assertion, running the query against the original table immediately also caused the assertion.
- AB_CIXMax generated the assertion far less often – about 5% of the time, suggesting the heap alone is not the problem, just that it makes it more likely. The spools remained.
- Neither of the tables without the max column generated a single exception, and in those cases, the spools were gone.
Now, this can't possibly ensure that the issue would never happen again. And while you might suggest the solution is as simple as changing the data type, I think the clustered index has additional benefits over and above making the issue happen less frequently. There are gains performance-wise and, also, the smaller column can now be a part of the formal key (useful for joins and sorting). Here is the breakdown of metrics from a typical run:
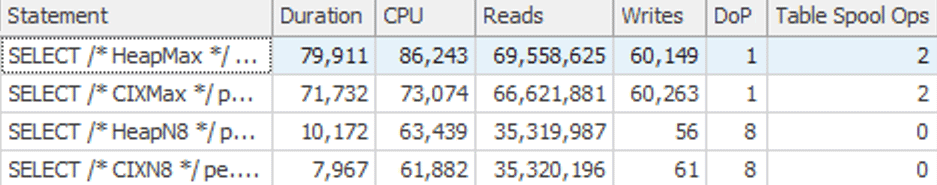 Performance profiles of the four tables
We see a minor gain in both cases when changing from a heap to a clustered index, but the really big win is when we move away from the heap and use the right data type. We eliminate the spools (and the writes involved with those), halve the reads, and gain benefits from parallelism; combined, this takes the original 80 second runtime down to 8 seconds, a 10X improvement.
Summary
This table should never have been a heap, and the column shouldn't have been a LOB. Those two factors alone should of course not lead to assertions, stack dumps, and misplaced warnings about corruption, but that is a bug we can pursue with Microsoft independent of making changes to the original table. In the meantime, we can work around it (and improve performance) by changing the table, without the users having to change their query, and without having to wait for a fix.
Hi Joe, it is ECC memory, and whether it's a hardware issue, I'll let you know what I hear back from Microsoft when I get through a support incident. There's a bug lurking here in SQL Server in either case… if the issue is hardware then it's not being bubbled up to the user correctly.
I am currently working on a project in which there is abusive use of columns defined as nvarchar(max). Many of these do not have large fields, and a dozed or so that can be up to approx. 100KB. I did notice one row having data error that took some doing to eliminate, i.e, Selecting every other row into a new table and dropping the original. If a varchar(max) is not actually larger than 8000bytes, it is not stored in an lob page. I assumed there would be some overhead in the intermediate structures must being able to accommodate a very large value, but i did not measure nor notice this. Could the error you are seeing be a hardware issue? is this on a system with ECC memory?
In a previous project, I did notice that when data is not in the buffer cache, disk IO for lob pages is very inefficient in that SQL Server does not issue asynchronous IO for lob pages, which can be a serious issue for high IOPS capable storage systems. A question is whether SQL Server must make direct OS (Virtual Address Space) memory allocations to work with max and xml fields?
There are also serious performance issues in using the DataReader and the generic GetString method, one must use the GetChars method with a buffering system. If the data is highly compressible with the newish COMPRESS function, then this is highly desirable.