
In a current project, I need to collect performance counters from a set of virtual machines that are performing different tasks and running a variety of workloads. In a similar project last year, I used LogMan to collect performance data. This time I decided to try PowerShell because, well, all the kids are doing it, I felt a little passé, and a lot of the other tasks in this project (such as building out VMs and running workloads) were already being accomplished via PowerShell. And after all, I did include "to become better at PowerShell" as one of my goals for this year.
I searched around and quickly found this post from Rhys Campbell (@RhysCampbell). He was collecting a set of counter samples every n seconds and outputting each sample to its own CSV file. I thought this was a very useful starting point to where I wanted to be. But, I had some troubles getting the script to work correctly at first: if I combined -ComputerName and multiple counters, I would receive this error:
…
+ CategoryInfo : InvalidResult: (:) [Get-Counter], Exception
+ FullyQualifiedErrorId : CounterApiError,Microsoft.PowerShell.Commands.GetCounterCommand
It would work fine if I either omitted -ComputerName *OR* only used one counter. So not sure exactly what the problem was there, as it certainly wasn't a connectivity issue. But a workaround I stumbled upon several hours later was to use the @(counter, counter) collection notation instead of the += syntax Rhys had presented. So instead of:
$listOfMetrics += ("\processor(0)\% processor time");
$listOfMetrics += ("\processor(1)\% processor time");
...
I used something more like this:
$listOfMetrics = @(
    "\processor(0)\% processor time",
    "\processor(1)\% processor time",
    ...
);
Because I wanted to collect different sets of metrics from different computers (some are SQL Servers, some are not), I made some slight adjustments to Rhys' script. I made it parameterized and, based on server role, I would define a different set of counters. This would allow me to very easily call the same script with slightly different arguments for each of the servers I wanted to monitor. My script (CollectPerf.ps1) looks like this – for brevity, I'm not going to list out all of the roles and all of the counters I'm actually collecting, but it should give you an idea of how to collect different counters for different computers or roles:
param([string]$server, [string]$role, [string]$test, [int]$delay, [int]$count, [string]$path)

function CollectPerf {
  param(
    [string]$server,
    [string]$role,
    [string]$test,
    [int]$delay,
    [int]$count,
    [string]$path
  )

    if ($role -eq "app server")
    {
      $counters = @("\Processor(_Total)\% Processor Time",
        "\System\Processor Queue Length"
        # -- other counters
      )
    }

    if ($role -eq "db server")
    {
      $counters = @("\PhysicalDisk(_Total)\Avg. Disk sec/Read",
        "\SQLServer:SQL Statistics\Batch Requests/sec"
        # -- other counters
      )
    }

    # other roles...

    $sequence = 1;

    $metrics = Get-Counter -ComputerName $server -Counter $counters -SampleInterval $delay -MaxSamples $count

    foreach($metric in $metrics)
    {
      $obj = $metric.CounterSamples | Select-Object -Property Path, CookedValue, Timestamp;
      # add these columns as data
      $obj | Add-Member -MemberType NoteProperty -Name Sequence -Value $sequence -Force;
      $obj | Add-Member -MemberType NoteProperty -Name LoadTest -Value $test     -Force;
      $obj | Add-Member -MemberType NoteProperty -Name Computer -Value $server   -Force;
      # export with unique file name
      $obj | Export-Csv -Path "$path$server.$test.$sequence.csv" -NoTypeInformation;
      $sequence += 1;
    }
}
CollectPerf -server $server -role $role -test $test -delay $delay -count $count -path $path
The problem with the script approach is that if I wanted to simultaneously collect metrics from different servers involved in the workload, I would expect to be able to do this (let's pretend there are only two arguments, again for brevity):
C:\path\CollectPerf.ps1 "server1" "app server"
C:\path\CollectPerf.ps1 "server2" "database server"
However, this runs the set of counters for server1, and doesn't start collecting for server2 until server1 is finished. Because I needed these to run asynchronously, and I didn't want to open dozens of individual PowerShell windows, I realized I should use a PowerShell job. So I could instead do this:
StartJob -ScriptBlock { C:\path\CollectPerf.ps1 "server1" "app server" }
StartJob -ScriptBlock { C:\path\CollectPerf.ps1 "server2" "database server" }
Which worked fine if I hard-coded the arguments. But another strange thing happened with this syntax (admittedly, it's not "strange" – just strange to me) when I tried to parameterize the server and role. If I used any of these conventions (and several other attempts I've omitted for their silliness):
Start-Job -ScriptBlock { C:\path\CollectPerf.ps1 $server $role };
Start-Job -ScriptBlock { C:\path\CollectPerf.ps1 $server $role } -ArgumentList $server $role;
Start-Job -ScriptBlock { C:\path\CollectPerf.ps1 $server $role } -ArgumentList $server, $role;
Start-Job -ScriptBlock { C:\path\CollectPerf.ps1 $args[0] $args[1] } -ArgumentList $server $role;
Start-Job -ScriptBlock { C:\path\CollectPerf.ps1 $args[0] $args[1] } -ArgumentList $server, $role;
In each case, the job would start fine (or return an error about params), but even though it would run, it was clear from the output that the parameters were not passed in correctly (they were treated as empty strings). So instead I tried this, once again switching to @(arg, arg) notation…
Start-Job -ScriptBlock { C:\path\CollectPerf.ps1 $args[0] $args[1] } -ArgumentList @($server, $role);
…and suddenly all was well with the world. (I talked about this in a recent blog post, entitled, "PowerShell, Start-Job, -ScriptBlock = sad panda face.") So, if you're trying to use Start-Job with -ScriptBlock, keep this convention in mind. Once I had the syntax down, I was able to collect metrics from dozens of servers using one command line call, by creating a second PowerShell script (CollectPerfAcrossServers.ps1) with this code and a command for each of the servers I was interested in:
param([string]$test, [int]$delay, [int]$count, [string]$path)              function CollectPerfAcrossServers
{
  param([string]$test, [int]$delay, [int]$count, [string]$path)

  Start-Job -ScriptBlock { C:\path\CollectPerf.ps1 "VM1" "db server"  $args[0] $args[1] $args[2] $args[3] } -ArgumentList @($test, $delay, $count, $path);
  Start-Job -ScriptBlock { C:\path\CollectPerf.ps1 "VM2" "app server" $args[0] $args[1] $args[2] $args[3] } -ArgumentList @($test, $delay, $count, $path);

  # ...more servers, more servers, more servers...
  # arguably, I should probably be pulling the list of servers and roles from a config file
}

CollectPerfAcrossServers -test $test -delay $delay -count $count -path $path;
Now that I have dozens of servers configured this way, I can log onto a central monitoring server and collect all of their role-based performance counters simultaneously, every 30 seconds for an hour, with this single command line:
C:\path\CollectPerfAcrossServers.ps1 "Jan.31.Baseline" 30 120 "C:\csv\"
And when I want to run a different test, all I have to change is the first argument. Once I run this command, it fills the directory up with CSV files – it can add up quickly (one file, per server, per sample). If I have 20 servers and collect a sample every 30 seconds for an hour, that's 2,400 files. However, even if I am collecting 50 counters for a specific role, the files are quite small and very easy to consume. (Note that the files won't be dumped into the folder until the last sample is collected, so to verify it's working, start with a small number of samples.) The output is not as pretty as it could be, but it works:
"\\vm1\\network interface(_total)\bytes received/sec","19150.7500680961","17636201111", "1/31/2011 3:43:24 AM","58","Jan.31.Baseline","VM1"
"\\vm1\\network interface(_total)\bytes sent/sec","65151.1215576817","12987234638", "1/31/2011 3:43:24 AM","58","Jan.31.Baseline","VM1"
"\\vm1\\network interface(_total)\output queue length","0","0", "1/31/2011 3:43:24 AM","58","Jan.31.Baseline","VM1"
There are a couple of things worth noting here. One is that everything is output as a string and has delimiters, so in order to perform any calculations or to get it into a table with numeric / datetime data types, you need to first strip the quotes. The computer name is redundantly included in both the Path column and the Computer column – I could have left the extra Computer column out of the CSV, but it's just as easy to parse it out of the Path after load – however the Path value is exported as lower case to the CSV file, so that needs to be accounted for as well. Another thing to watch out for is that the output for the Timestamp property obeys regional settings of the collecting machine, so if you are pulling counters on a server with mm/dd/yyyy and loading the data into a SQL Server that is using dd/mm/yyyy, you're going to need to manually convert the original string to the correct regional format.
Once I sorted those variables out, I created a table that would house all this data, and whipped up the T-SQL that would generate BULK INSERT commands for all of the files and then move everything to a table with proper datatypes and with string delimiters removed:
CREATE TABLE dbo.PerfCounters_Staging
(
    [Path]      nvarchar(255),
    CookedValue varchar(32),
    [Timestamp] varchar(32),
    [Sequence]  varchar(12),
    LoadTest    varchar(32),
    Computer    varchar(32)
);

CREATE TABLE dbo.PerfCounters
(
    [Path]      nvarchar(255),
    CookedValue decimal(18, 5),
    [Timestamp] datetime,
    [Sequence]  smallint,
    LoadTest    varchar(32),
    Computer    varchar(32)
);

-- generate bulk insert commands

CREATE TABLE #c(x varchar(2048));

SET NOCOUNT ON;
INSERT #c EXEC master..xp_cmdshell 'dir /b "C:\csv\"';

SELECT 'SET NOCOUNT ON;';

SELECT 'BULK INSERT dbo.PerfCounters_Staging FROM "C:\csv\' + x + '"
    WITH (FIRSTROW = 2, ROWTERMINATOR=''\n'', FIELDTERMINATOR='','');'
    FROM #c WHERE x IS NOT NULL;

DROP TABLE #c;
When I was done with a load test, I would run the above command (with SSMS set Results to Text), focus on the results pane, press Ctrl+A, press Ctrl+C, then paste the lot to a new SSMS window, and then finally run that script. Then I would run this command to clean it up and put it into the real table:
DELETE dbo.PerfCounters
WHERE LoadTest IN
(
    SELECT DISTINCT LoadTest
        FROM dbo.PerfCounters_Staging
        WHERE LoadTest > ''
);

INSERT dbo.PerfCounters
(
    [Path],
    CookedValue,
    [Timestamp],
    [Sequence],
    Computer,
    LoadTest
)
SELECT
    [Path]      = REPLACE(REPLACE([Path], '\\'
                  + RTRIM(LOWER(Computer)) + '\', ''), '"', ''),
    CookedValue = REPLACE(CookedValue, '"', ''),
    [Timestamp] = REPLACE([Timestamp], '"', ''),
    [Sequence]  = REPLACE([Sequence], '"', ''),
    [Computer]  = REPLACE(Computer, '"', ''),
    [LoadTest]  = REPLACE([LoadTest], '"', '')
FROM
    dbo.PerfCounters_Staging;
Then I would empty out the folder manually (I could automate that too, but I wasn't running 500 tests a day, so it seemed to be of little benefit). Now I had the data loaded for that specific test; I just had to be careful to make my test names unique – so I would include the date and, if necessary, some other identifier in the test name. This kept tests unique but, if necessary, allowed me to re-run a specific test later, without having to go back and manually delete anything from the database.
Now I could query away. The reason I included the [Sequence] column is so that I could correlate the event order across multiple tests, without worrying about specific datetime information, rounding, etc. This let me easily compare any given metric between tests run on different days. I wrote two generic stored procedures that would allow me to compare anywhere from 2-5 different tests on a given system; one would give me the average and maximum values for a certain counter, and the other would give me the series:
CREATE PROCEDURE [dbo].[Perf_AvgMax]
   @counter  varchar(255) = '\processor(_total)\% processor time',
   @computer varchar(32)  = 'VM1',
   @test1    varchar(32)  = 'Jan.31.Baseline',
   @test2    varchar(32)  = 'Jan.31.TPCLoadA',
   @test3    varchar(32)  = NULL,
   @test4    varchar(32)  = NULL,
   @test5    varchar(32)  = NULL
AS
BEGIN
   SET NOCOUNT ON;

   SELECT computer = @computer, [counter] = @counter;

   SELECT test1 = @test1, test2 = @test2, test3 = @test3,
          test4 = @test4, test5 = @test5;

   ;WITH x AS
   (
       SELECT CookedValue, LoadTest, Sequence
         FROM dbo.PerfCounters
         WHERE [Path] = @counter
         AND Computer = @computer
   )
   SELECT
       AVG(a.CookedValue),
       AVG(b.CookedValue),
       AVG(c.CookedValue),
       AVG(d.CookedValue),
       AVG(e.CookedValue),
       MAX(a.CookedValue),
       MAX(b.CookedValue),
       MAX(c.CookedValue),
       MAX(d.CookedValue),
       MAX(e.CookedValue)
   FROM x AS a
   INNER JOIN x AS b
   ON a.Sequence = b.Sequence
   AND a.LoadTest = @test1
   AND b.LoadTest = @test2

   LEFT OUTER JOIN x AS c
   ON b.Sequence = c.Sequence
   AND c.LoadTest = @test3

   LEFT OUTER JOIN x AS d
   ON c.Sequence = d.Sequence
   AND d.LoadTest = @test4

   LEFT OUTER JOIN x AS e
   ON d.Sequence = e.Sequence
   AND e.LoadTest = @test5;
END
GO

CREATE PROCEDURE [dbo].[Perf_Series]
   @counter  varchar(255) = '\processor(_total)\% processor time',
   @computer varchar(32)  = 'VM1',
   @test1    varchar(32)  = 'Jan.31.Baseline',
   @test2    varchar(32)  = 'Jan.31.TPCLoadA',
   @test3    varchar(32)  = NULL,
   @test4    varchar(32)  = NULL,
   @test5    varchar(32)  = NULL
AS
BEGIN
   SET NOCOUNT ON;

   SELECT computer = @computer, [counter] = @counter;

   SELECT test1 = @test1, test2 = @test2, test3 = @test3,
          test4 = @test4, test5 = @test5;

   ;WITH x AS
   (
       SELECT CookedValue, LoadTest, Sequence
         FROM dbo.PerfCounters
         WHERE [Path] = @counter
         AND Computer = @computer
   )
   SELECT
       a.[Sequence],
       test1 = a.CookedValue,
       test2 = b.CookedValue,
       test3 = c.CookedValue,
       test4 = d.CookedValue,
       test5 = e.CookedValue
   FROM x AS a
   INNER JOIN x AS b
   ON a.Sequence = b.Sequence
   AND a.LoadTest = @test1
   AND b.LoadTest = @test2

   LEFT OUTER JOIN x AS c
   ON b.Sequence = c.Sequence
   AND c.LoadTest = @test3

   LEFT OUTER JOIN x AS d
   ON c.Sequence = d.Sequence
   AND d.LoadTest = @test4

   LEFT OUTER JOIN x AS e
   ON d.[Sequence] = e.[Sequence]
   AND e.LoadTest = @test5
   ORDER BY a.Sequence;
END
GO
To compare seconds per disk write on VM1 during three different load tests, I could run this query:
EXEC dbo.Perf_Series
    @computer = 'VM1',
    @counter  = '\Processor(_Total)\% Processor Time',
    @test1    = 'Jan.31.Baseline',
    @test2    = 'Jan.31.TCPLoadA',
    @test3    = 'Jan.31.TCPLoadB';
Results:
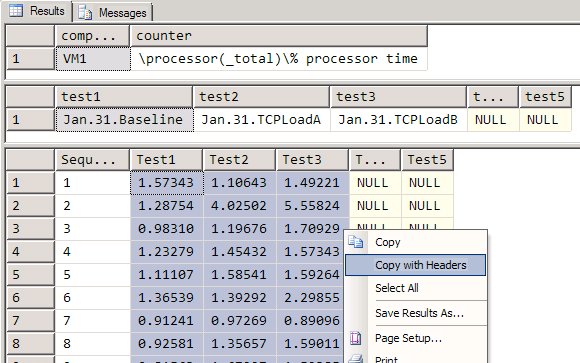
I could take those results, paste them into Excel, and build nice pretty charts with very little effort (click to embiggen):
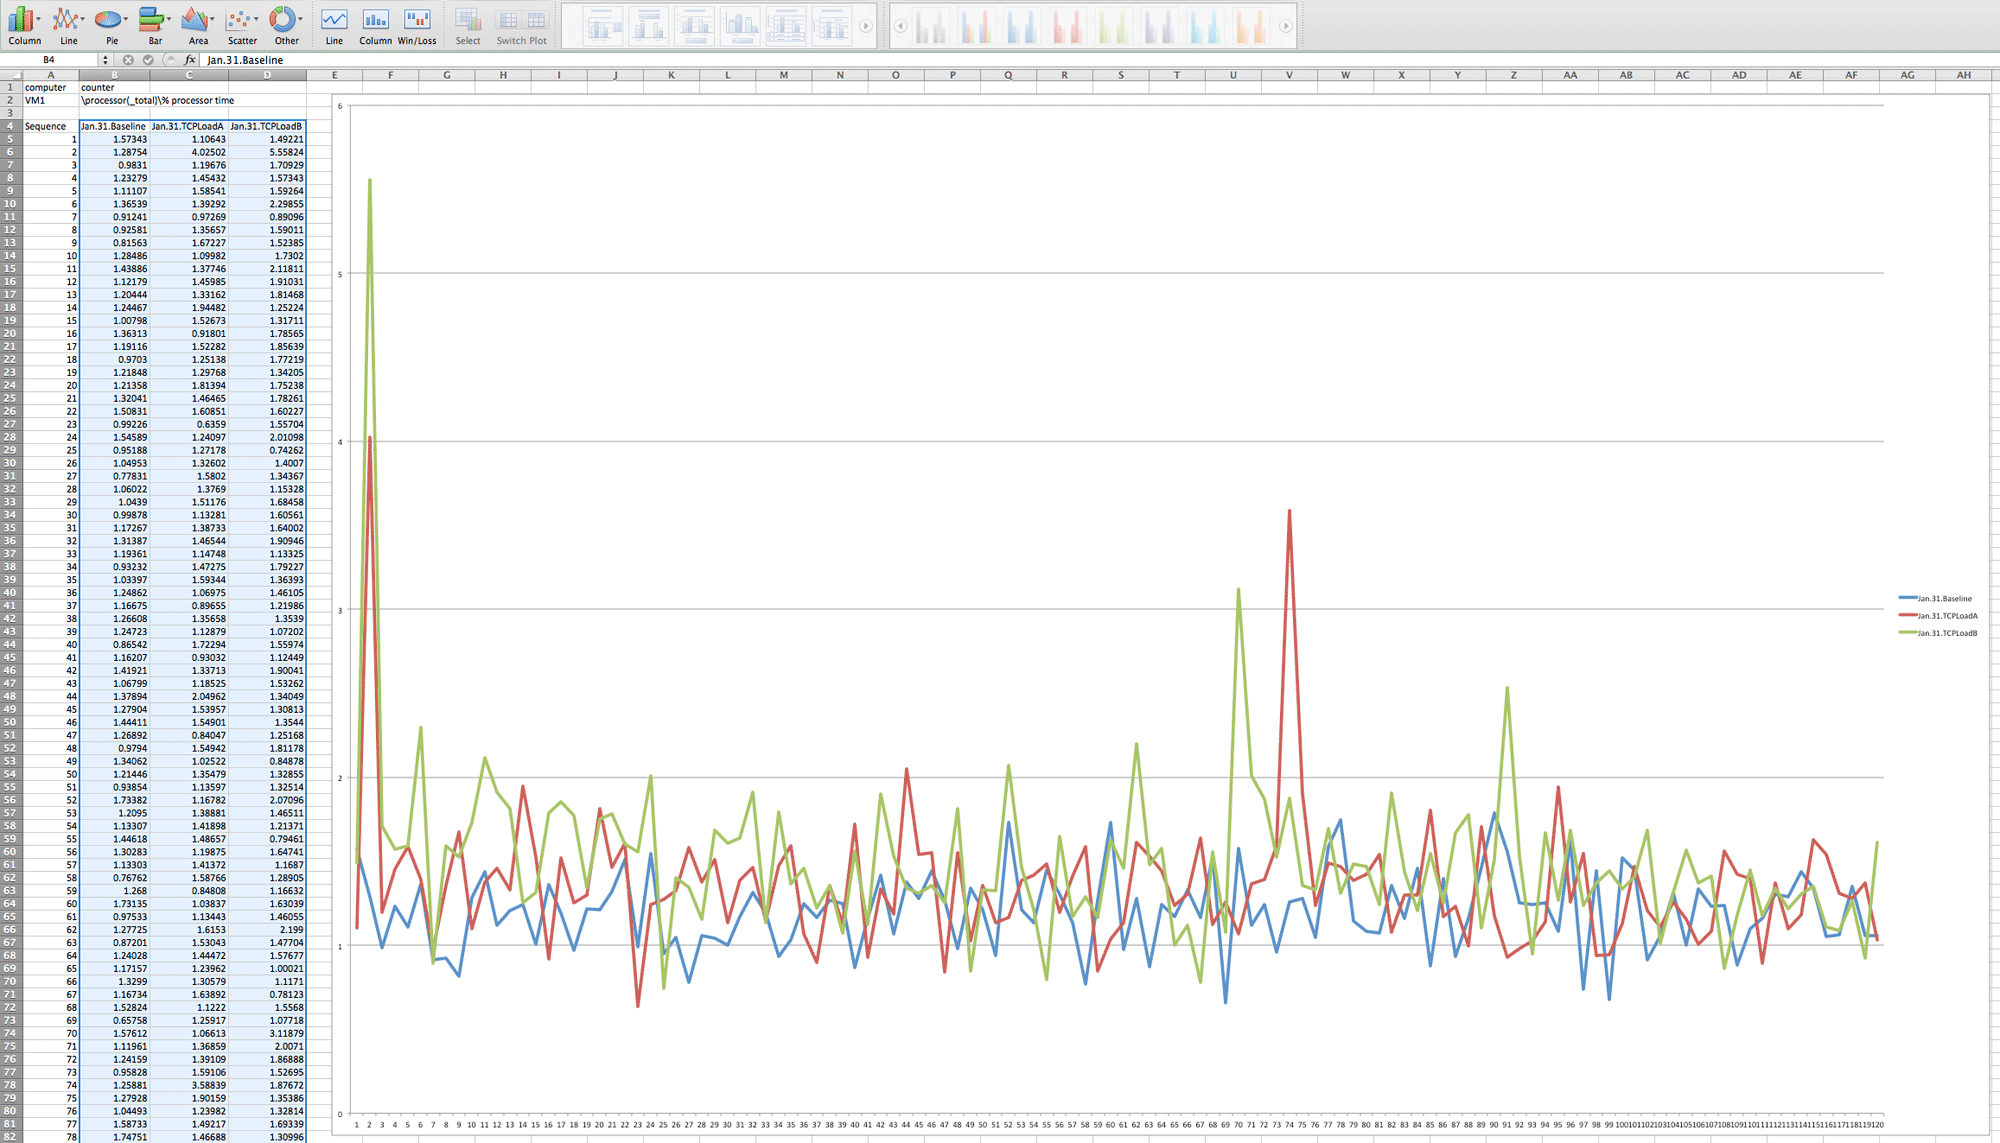
I have my 120 samples in a chart (regardless of when I ran each test) and, while I don't see any obvious trends in this specific case, I can try various metrics and combinations to see where any performance outliers may be. If nothing else I've proven to myself that my load tests are not CPU-bound in any way. For this project I am interested in the ways each specific computer's counters respond to changes in input variables (most importantly, the type of load put on the system). Of course you could write other queries around this data that compared how a certain counter responded on two servers for the same test, or several other analytic variations. What you do with the data is a different exercise altogether; I just thought I'd share how I collect the data in the first place.
There are probably 20 ways to do this, and I am by no means suggesting this is the way you should do it. I could have told PowerShell to load the data directly to the database, I could have easily generated and executed the BULK INSERT commands from PowerShell, I could have automated the reporting better using SSRS or charting tools – and there are likely 100 other ways this process could be further automated. This is just the method I settled on after a lot of trial and error, with a healthy balance of automation and manual labor. I'll get to full PoSH automation when I'm good and ready – in the meantime, I'm all ears for suggestions, but am unlikely to change much about how I'm using this process for the project at hand. 🙂 I find it fairly straightforward and easily extensible for adding servers, counters and tests.
For some other ways to collect performance counters with PowerShell, check out these posts by Dave Ballantyne (twitter), Laerte Junior (blog | twitter), and Allen White (blog | twitter):
- Dave Ballantyne : My first useful powershell script – capturing performance counters
- Laerte Junior : Gathering Perfmon Data with Powershell
- Allen White : Performance Data Gathering
- Allen White : SQL Connections Presentations (download Allen's PowerShell decks and sample code)
What I like about PowerShell so far is that it seems, unlike in T-SQL, there is no "one way" or "best way" to do something – there may be a dozen ways to skin the cat, and you can use whichever one is most intuitive or works best for you, and you can even determine what reasons help you arrive at that decision.
In a future post, I'll talk about how I run load tests in this environment using remote sessions and jobs.
$Object =@()
$Counter = @"
Processor(_total)\% processor time
Memory\Available MBytes
Memory\Pages/sec
Physicaldisk(*)\% Disk Time
"@
(Get-Counter -ComputerName $ComputerName -Counter (Convert-HString -HString $Counter)).counterSamples |
The above code is a part of the shell script that collects perfmon counters from remote servers.I am trying to run it and I get the following error
Get-counter:unable to connect to the specified computer or the computer is offline
Get-counter -computername -counter $ComputerName -Counter (Convert-HString -HString $Counter)).counterSamples |
Category info : invalid result[get-counter]exception
fullyqualified error: CounterAPI Error,Microsoft.Powershell.Commands.GetCounterCommand
I tried some solutions from remote_troubleshooting but nothing worked.Plz help me resolve it.
Hi Aaron,
Great BLOG…Just an FYI several counters use a comma in thier paths, so people might have to add a quotation after the comma field delimitor for the bulk insert command above to get it to work correctly (ex. FIELDTERMINATOR=","").
Thanks.. I had the same thing in mind.. I need to first test run the collector program on test and measure if it causes any performance issues.. and keep the collector sets small in size..or multithreaded…
Consider that no monitoring is free. The only way you can really compare is to have one set of metrics being collected in a consistent way through all tests, then add an additional second collection for each method. I don't know how you can baseline a system without collecting metrics – seems kind of chicken and egg to me. The only other way would be to see if collection has any direct impact on the normal activity of the box – is your workload slower when you collect? How much slower? Again, collecting performance metrics is not free, but it's highly doubtful that collecting a reasonable set of perfmon counters at a sensible interval will cause any significant strain.
Thanks Aaron for your prompt response. Any suggestion to baseline a heavily used OLTP system considering that the process/method used to gather system/sql server counters doesn't affects the systems performance?
Ahmad, I didn't do any performance impact analysis, and if I had, it would quite likely be different from your environment because of the number of variables involved. However if you have to collect performance counters, that's going to be the bulk of the cost, regardless of whether you use Powershell or other methods.
How far this affects the performance of a server the mentioned solution is being run for?
Oh so splatting is 'by reference' in vb or really a pointer to memory kinda like C?
I had to make reference of the variable from the calling function with an '@' and not a '$'
i.e.
ExecutePerformanceCounter -Machine $computer -CounterSet @CounterSet -Interval $Interval -MaxSample $MaxSample
Thanks for the article!
Aaron, is using multiple counters on remote machines using the Get-Counter cmdlet, wrapped in a function just not possible? I cannot get past this "Unable to connect…" message. I've tried Windows 7 32/64 (of PoSh ISE), Server 2003, 2012 32/64 (of Posh ISE)
Aaron,
When I do
get-counter "\\ServerA\processor(_total)\% processor time" I get result without any error but
when I do
get-counter "\\ServerB\processor(_total)\% processor time" I am getting the following error
Get-Counter : The specified object was not found on the computer.
At line:1 char:12
+ get-counter <<<< "\\ServerB\processor(_total)\% processor time"
+ CategoryInfo : InvalidResult: (:) [Get-Counter], Exception
+ FullyQualifiedErrorId : CounterApiError,Microsoft.PowerShell.Commands.GetCounterCommand
If I log into ServerB and run the command
"\processor(_total)\% processor time" I get the result without any problem. What is missing in ServerB that I cant get results from a remote machine.
Aaron, eventhough it fires the error in powershell window, but if iam running this powershell command under SQL server agent job it works perfectly alright and does what is expected to do.
Sorry, no, I've found PowerShell to be quite immature about reporting the right errors. I have encountered many issues where the reported error is not really what happened. This may be one of those cases. Have you verified that you can pull the same counters using perfmon or logman from the same machine? Is it a difference of pulling a single counter vs. multiple? What if you change the order?
Hi Aaron,
Iam getting the below error when iam accessing some of the performance counters for SSAS not for all the other perfmon counters but for only few, Do u have any idea why this happens?
Error:
r : Internal performance counter API call failed. Error: c0000bb9.
At C:\Soumya\PowershellPerfmon.ps1:4 char:39
+ $Counters = $CounterList | Get-Counter <<<< -computer $Servers
+ CategoryInfo : InvalidResult: (:) [Get-Counter], Exception
+ FullyQualifiedErrorId : CounterApiError,Microsoft.PowerShell.Commands.GetCounterCommand
Thank you very much for ur help it has worked now perfectly.
soumya, I'm not at a machine where I can test right now, but is it possible you've just forgotten the closing parenthesis?
$counters = @("\Processor(_Total)\% Processor Time", "\System\Processor Queue Length"
)
^
?
Iam getting this error if iam selecting the counter values
positional parameter cannot be found that accepts argument '\System\Processor Queue Length'.
At C:\perflogs\NewPerfmon.ps1:10 char:25
$counters = @("\Processor(_Total)\% Processor Time", "\System\Processor Queue Length"
and running the counter in the below given command
$metrics = Get-Counter -ComputerName $server -Counter $counters -SampleInterval $delay -MaxSamples $count
Can you help me on this?
hi Aaron,
I have been trying to your scripts to get perfmon data using powershell. The main problem I am having is adding additional filters to the counters e.g. If I run the following:
$listOfMetrices=(Get-Counter -ListSet "*Databases" -ComputerName $Hostname | where {$_.paths -like "*\transactions/sec"} ) $listOfMetrices | get-counter
It shows me all counters under database category…but what I really want to see is transactions/sec for each database.
i don't want to specify the exact counter name because I am running this on various remote servers.
Please help
Regards
Manjot
Thanks Aaron,
I figured that c$ was sequence.
And yes the other post is indeed the post i found and read.
For now i have moved the development to a server and will wait patiently for patches/upgrades to PS
Sorry MortenDvinge, $c should have been $sequence (I prettified my lazy variable names before publishing).
As for append, no, Export-CSV does not currently support append. We should finally see this in the next version of PowerShell.
http://web.archive.org/web/*/http://web.archive.org/web/*/https://connect.microsoft.com/PowerShell/feedback/details/525407/add-an-append-switch-to-export-csv
I was unable to fix this issue for Windows 7. The script was originally derived from a post by Rhys Campbell, and that is probably where you saw more dialog about this issue:
http://www.youdidwhatwithtsql.com/performance-benchmarking-with-powershell/909
Ok I figured the first part out myself.
On you script i was supposed to get 20 small files and not 1.
It was the parameter $c with no value that caused the filename to be the same and therefore overwriting. Guess there is no append property …
I would still be pleased if you have any info on my 2nd question
Br.
/M
Hi Aaron,
I hope you can give me a hint.
Running with -MaxSamples ex. 20 with you code in CollectPerf.ps1
Does not give me a result in the csv file for each of the 20 samples on the counters. I just receive the last sample on each counter (in my example sequence 20)
What am I missing?
Another thing is that I am not able to run GET-COUNTER specifying a server in windows 7. I recall that i have seen (in another forum) you had the same problem. Any updates on that? Unfortunately I haven't been able to find a solution anywhere.
It's all math, Uri. If you want to take a sample every 30 seconds for 2 hours, then you would use 30 240. If you want to take a sample every 15 seconds for 2 hours, then you would use 15 480. If you want to a sample every minute for 2 hours, then you would use 60 120. Etc. etc.
Thanks Aaron
So if I need to cover two hours for example what do I need to change?Sorry about it , I am learning from you such good things
Uri, the arguments are:
-test $test -delay $delay -count $count -path $path;
-test is the name of the test (e.g. "Baseline" or "HighLoad")
-delay is how long, in seconds, to wait between samples
-count is how many total samples to take
-path is the folder to output the CSV files
So 30 120 means take 120 samples, 30 seconds apart. This covers a workload that has been tuned to run for approximately one hour.
Hi Aaron
Great post, thank you
C:\path\CollectPerfAcrossServers.ps1 "Jan.31.Baseline" 30 120 "C:\csv\"
In above can you expain what does 120 value mean? What impact?
Good timing…Ed Wilson posted a counter script on http://blogs.technet.com/b/heyscriptingguy/ from 31 Jan about collecting performance counters with PowerShell. I got done reading it and was wondering if you or Aaron Nelson had a post about doing this with SQL Server counters.
Tips for DBA: Store Performance Counters in Database (Job-Step: Power Shell)
http://msmvps.com/blogs/gladchenko/archive/2009/03/15/1678369.aspx